This article was updated on December 20, 2023. Contributions were made by Darlene Hildebrandt. Anne McKinnell. Herb Paynter. Rick Berk. Simon Ringsmuth.
Do you struggle to understand the histograms used in photography? You want to learn how to read histograms so that you can get consistently accurate exposures.
Prior to digital photography, it was necessary to wait for the film to be developed to determine if you were getting a good exposure. By using the histogram you can get this information at any time, even before developing your film. The shooting process and post-production are both included.
This article will cover everything you need in order to start histogram photography.
- What is a histogram?
- How to interpret the peaks on a histogram graph
- How to use the histogram in order to avoid overexposure or underexposure
- Mistakes and pitfalls in histograms
If you want to learn how to read histograms, keep reading!
What is a Histogram?
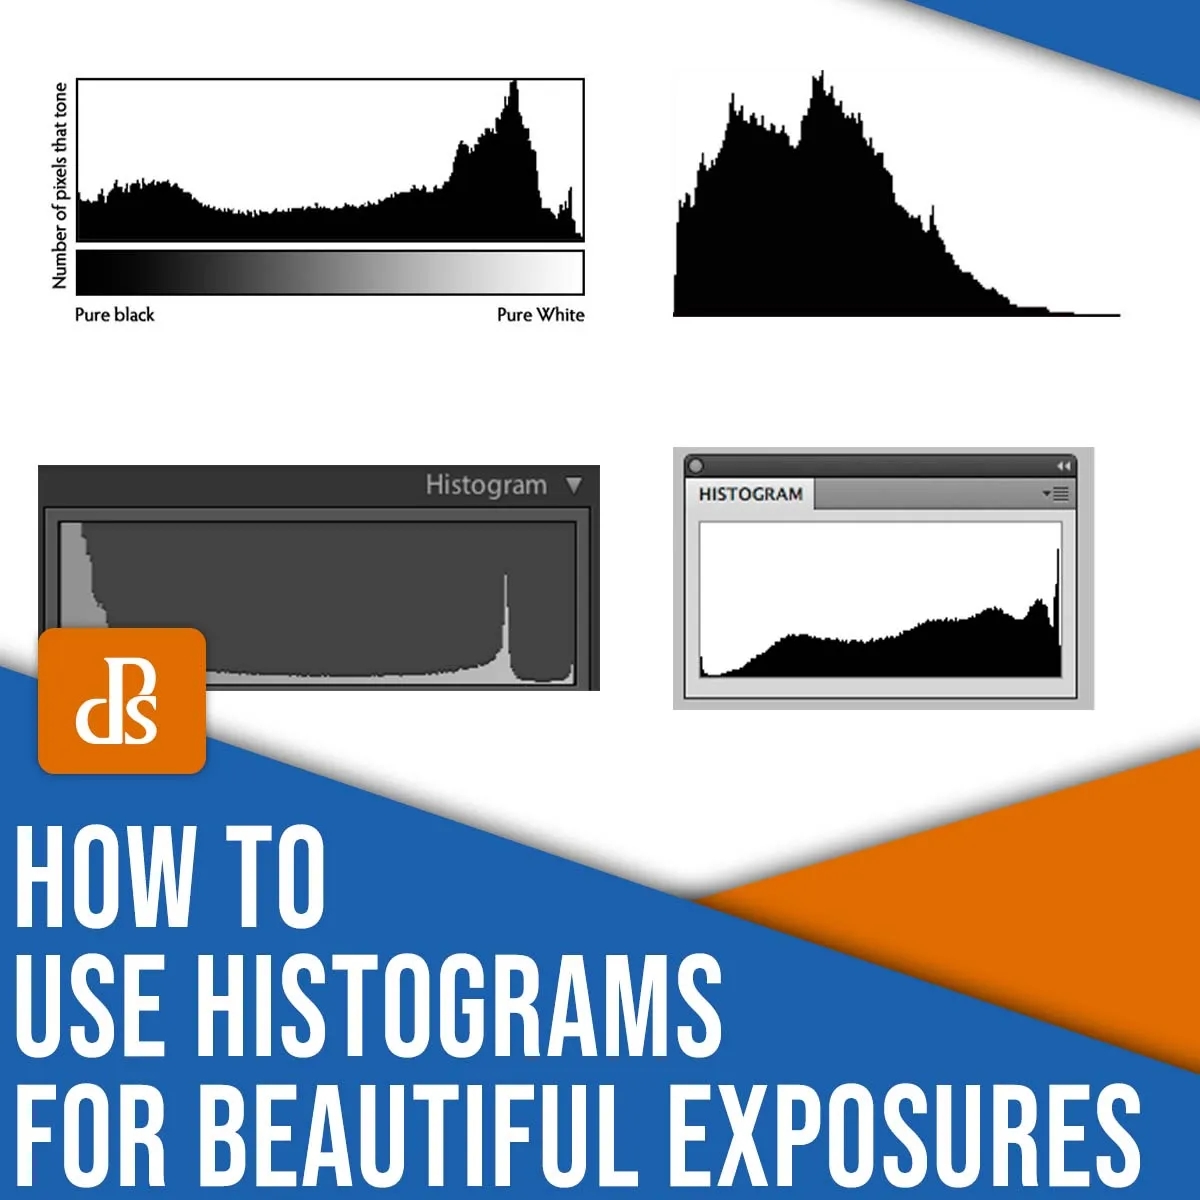
A histogram represents the tones of an image, including the highlights, shadows and everything between.
Each image has its own histogram. This is displayed by your camera as well as most post-processing software.
Why is a Histogram useful to you?
A detailed exposure is a goal in photography (i.e. a photo that has well-rendered midtones, shadows and highlights).
While you can check the exposure of your images by using your camera’s electronic viewfinder or LCD screen, as well as by viewing them on your computer, a histogram is a better way to evaluate the tones.
The histogram shows blown-out highlights (detailless). It also shows clipped shadows (detailless).
This iswhy histograms are so popular with photographers. Learning how to use one is also essential. You can check your exposure quickly and accurately when you are out in the field, or editing at home, if you know how to read a histogram.


